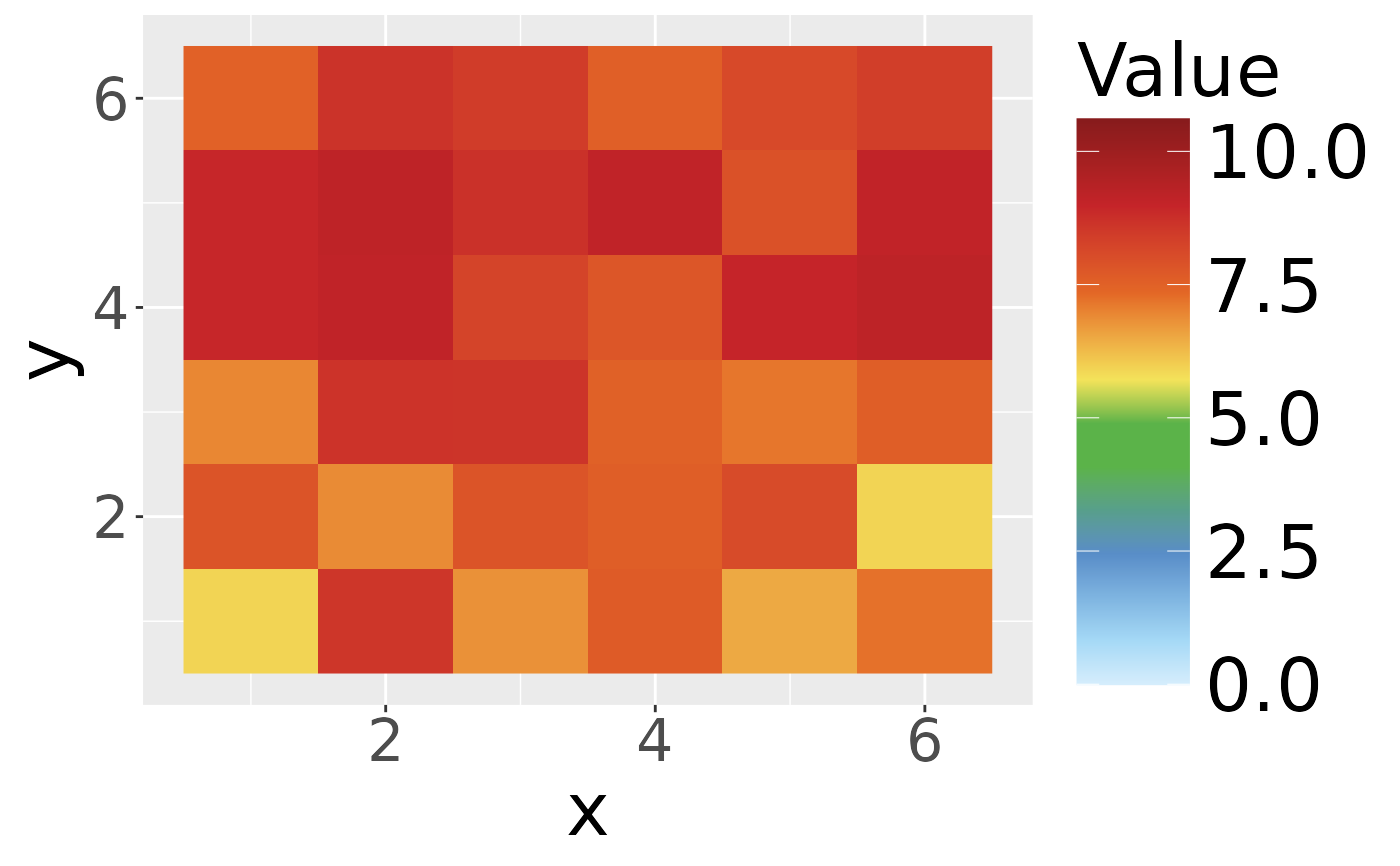
Creates a ggplot2 raster heatmap using the col_bgr colour
palette with a squished colour scale capped at max_y.
Examples
if (requireNamespace("ggplot2", quietly = TRUE) &&
    requireNamespace("ggpubr", quietly = TRUE) &&
    requireNamespace("scales", quietly = TRUE)) {
  data("dt_calibration")
  d <- dt_calibration
  dt <- data.frame(x = d$grid$col, y = d$grid$row, fill = d$field$z[10, ])
  p <- quick_heat(dt, max_y = max(d$field$z))
  class(p)
  p
}